Gas-Phase Molecules Illuminated from Within
Seeing is believing, and the importance of visualization is obvious at the molecular level, which lies outside the realm of everyday experience. But because traditional techniques for probing within molecules (such as photoelectron diffraction) require knowledge of the molecule's orientation, they can't provide very information-rich pictures for molecules in the gas phase. Addressing this problem, an international collaboration of researchers has demonstrated a multiparticle coincidence technique at the ALS that yields comprehensive photoelectron diffraction data for gaseous carbon monoxide as if the molecules were fixed in space. The most striking aspect of viewing molecules "illuminated" from within this way is how the results reveal, nearly at a glance, the major physical features at play.
|
In x-ray photoelectron diffraction (XPD), a core-level electron is ejected from one atom in a molecule by an incoming x ray. The ejected photoelectron wave, diffracted by neighboring atoms, provides a signature of the nonspherical potential of the molecule. However, to fully observe the rich, three-dimensional structure of the electron wave, knowledge of the orientation of the molecule is required. In most cases, the material under investigation is in solid form (crystal or adsorbate) and can be easily oriented in the laboratory. Determining the orientation of a freely moving molecule, however, requires some experimental finesse.
|
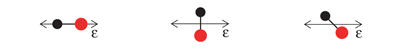
In Living ColorImagine trying to watch your favorite television program on a defective set that can display only a few narrow slices of the picture at a time. You would be able to see small changes with each successive display, perhaps some colors appearing and disappearing, or moving from side to side. There are clues that something interesting is happening, but what? Even a simple test pattern could appear confusing if viewed one random slice at a time. This frustrating situation is comparable to that faced by researchers trying to observe electrons ejected from randomly moving gas molecules. The way such electrons end up distributed in space reveals information about the state of the molecule. However, to relate the emission pattern to the molecule, you need to know how the molecule was oriented at the time of emisssion. For a simple diatomic molecule like carbon monoxide, this can be determined by breaking the molecule apart and observing which way the fragments fly. Previous experiments in this vein provided only glimpses of the electron distribution for a few selected directions or molecular orientations. The technique described here captures the full picture with high efficiency and resolution, allowing scientists to see the entire electron distribution for a given molecular orientation as well as how the image evolves as the molecule is rotated. |

|
|
||
|
At Beamline 9.3.2, a beam of CO gas can be crossed with a beam of linearly polarized x rays. This removes the C 1s electron and leaves the molecule in a highly excited state. The molecule then rapidly dissociates into C and O positive ions. The fragments (ions and electrons) are drawn by electric and magnetic fields toward position-sensitive detectors. Only triple coincidences between two ions and one electron are recorded. From the times of flight and the impact positions, the momenta of all particles in all directions are calculated. Because the dissociation time of ionized CO is substantially shorter than its rotation period, measurement of the C and O momentum vectors gives the molecule's orientation upon photoionization. In contrast to previous experiments, this technique records, with high efficiency and resolution, the full picture of the outgoing electron wave for all orientations of the molecule simultaneously. One can, by computer analysis, select and organize the results to show the electron emission pattern as if all the molecules were oriented in the same way; the reseacher simply chooses how to view the process and sorts the data accordingly. For example, the data can be displayed in a map of the photoelectron momentum vectors, where the azimuthal angle gives the direction of the photoelectron emission, the radial distance gives the photoelectron energy, and the emission intensity is indicated by color. The resulting pictures are rich in physics: one sees the outgoing wave resonating in the molecular potential at a certain energy (i.e. at a constant radius) and displaying interference from reflection off of the oxygen partner ("bright" spot when the molecular axis is aligned with the x-ray polarization e). An alternative depiction, in polar coordinates, lets us compare the experimental photoelectron momentum data to calculations based on linear combinations of partial waves. The high fidelity of the fitted curves to the data demonstrates that the contributions of different partial waves to the photoelectron wave can be successfully extracted from the data. |
||
|
|
||
|
While the researchers chose a simple ground-state molecule for this demonstration, the technique might also be used to produce time-dependent snapshots of transient species. It may be possible to map the evolution of molecular potentials by initiating a photochemical reaction with a short laser pulse and later probing the molecule using a photoelectron wave generated by a time-delayed x-ray pulse. Thus, this approach to viewing molecules is a major step forward in our ability to obtain comprehensive information about molecular dynamics and structure from photoelectron emission. |
||
|
Research conducted by A. Landers (Western Michigan University); Th. Weber, M. Hattass, O. Jagutzki, A. Nauert, and H. Schmidt-Böcking (Universität Frankfurt); I. Ali, T. Osipov, and C.L. Cocke (Kansas State University); A. Cassimi (Université de Caen); A. Staudte (Universität Frankfurt and Berkeley Lab); M.H. Prior (Berkeley Lab); and R. Dörner (Universität Frankfurt). Research funding: Bundesministerium für Bildung und Forschung; Deutsche Forschungsgemeinschaft; and the U.S. Deptartment of Energy, Office of Basic Energy Sciences (BES), Chemical Sciences, Geosciences and Biosciences Division. Operation of the ALS is supported by BES. Publication about this research: A. Landers, Th. Weber, I. Ali, A. Cassimi, M. Hattass, O. Jagutzki, A. Nauert, T. Osipov, A. Staudte, M.H. Prior, H. Schmidt-Böcking, C.L. Cocke, R. Dörner, "Photoelectron Diffraction Mapping: Molecules Illuminated from Within," Phys. Rev. Lett. 87, 013002 (2001). |
||


ALSNews
Vol. 189, November 28, 2001
Text and pictures have been taken from:
www-als.lbl.gov/als/science/sci_archive/46gasXPD.html
with permission of the ALS.